- HOME
- Products & Services
- Application Selection Guide
- Microbial Community Analysis
Microbial Community Analysis
- Overview
- Workflow
- Target Regions (PCR Primers)
- Analysis Plan
- Sample Requirements
- Standard Data Analysis
- Optional Data Analysis
- Frequently Asked Questions
Overview
Using genomic DNA extracted from samples such as feces or soil, we perform PCR amplification of marker genes such as 16S rRNA, followed by deep sequencing. This process identifies the types and relative abundances of microbes present in the samples.
Workflow
| Genomic DNA Extraction: From soil, feces, etc. | ||||
| ↓ | ||||
| 1st PCR: Amplify target regions and add linker sequences. | ||||
| ↓ | ||||
| 2nd PCR: Add adapter sequences. | ||||
| ↓ | ||||
| Sequencing | ||||
| ↓ | ||||
| Standard Data Analysis: Includes microbial composition and α-diversity calculations. | ||||
| ↓ | ↓ | ↓ | ||
| PCoA Plot | Statistical Significance Testing (PERMANOVA) |
Statistical Significance Testing (Differential Abundance Analysis) |
||
Target Regions (PCR Primers)
We provide the following primers as standard.
Please contact us if other target regions are required.
| Target Region | Primer Features | Reference |
|---|---|---|
| Bacteria 16S rRNA V3-V4 (341F / 805R) |
Our standard primer for amplifying bacteria and some archaea. | Herlemann, Daniel PR, et al. The ISME journal 5.10 (2011): 1571-1579. |
| Bacteria 16S rRNA V3-V4 (341F’ / 805R) |
Improved efficiency for archaea compared to 341F / 805R. | Hugerth, Luisa W., et al. Applied and environmental microbiology 80.16 (2014): 5116-5123. |
| Bacteria 16S rRNA V3-V4 (335F / 769R) |
Suppresses amplification of plant chloroplast 16S rRNA, ideal for plant-contaminated samples. | Dorn-In, Samart, et al. Journal of microbiological methods 113 (2015): 50-56. |
| Fungi ITS1 (ITS1-F_KYO1 / ITS2_KYO2) |
Primer set for fungi. | Toju, Hirokazu, et al. PloS one 7.7 (2012): e40863. |
Analysis Plan
Shared Sequencing
Data Amount: MiSeq 300bp paired-end sequencing (~100,000 read pairs/sample).
| DNA extraction | 15,000 JPY / sample or conducted by the customer.* |
|---|---|
| 1st PCR & purification | 10,000JPY / sample or conducted by the customer. |
| 2nd PCR & purification | 60,000 JPY / sample. |
| MiSeq sequencing | |
| Data analysis |
Dedicated Run
Data Amount: MiSeq 300bp paired-end sequencing (~16 million read pairs/run, ~30% PhiX control).
Sample Requirements
| Sample Type | Required Amount | Storage/Shipping Temperature |
|---|---|---|
| Sludge | 5 – 10 mL | Refrigerated |
| Soil | 1 – 5 g | Refrigerated |
| Feces | 0.2 – 0.5 g | Frozen |
| Saliva | 0.2 – 1 mL | Frozen |
| Sample Type | Total Amount | Concentration | Volume |
|---|---|---|---|
| Purified Genomic DNA | ≥ 150 ng | ≥ 5 ng/µL | ≥ 30 µL |
| Sample Type | Total Amount | Concentration | Volume |
|---|---|---|---|
| Purified 1st PCR Product | ≥ 5 ng | ≥ 0.2 ng/µL | ≥ 20 µL |
| Sample Type | Total Amount | Concentration | Volume |
|---|---|---|---|
| Purified 2nd PCR Product | ≥ 150 ng | ≥ 5 ng/µL | ≥ 20 µL |
Standard Data Analysis
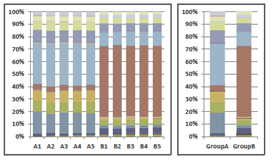
【Microbial Composition Calculation】
Identifies the types and relative abundances of microbes.
[Microbial composition]
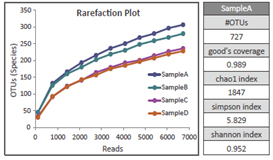
【α-Diversity Calculation】
Provides indicators of microbial diversity and data sufficiency.
[α-Diversity]
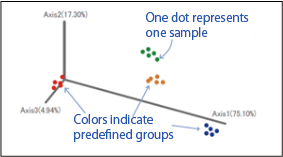
【PCoA Plot】
Visualizes similarities between samples based on microbial composition.
[PCoA Plot]
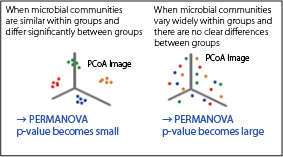
【Statistical Significance Testing (PERMANOVA)】
Tests for significant differences in microbial composition between specified groups.
[PCoA image]
Optional Data Analysis
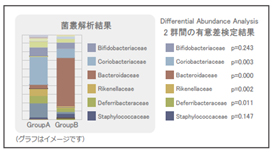
【Statistical Significance Testing (Differential Abundance Analysis)】
Examines the statistical significance of differences in microbial abundances between groups.
[Differential Abundance Analysis]
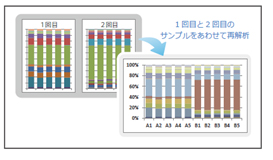
【Integration of Multiple Datasets】
Re-analyzes and integrates datasets from multiple analysis runs.
[Integration of multiple datasets]
Frequently Asked Questions
Q: How much sequencing data is required for analysis?
The required data amount varies depending on microbial diversity, but our standard plan includes ~100,000 read pairs/sample.
α-diversity analysis can help confirm data sufficiency.
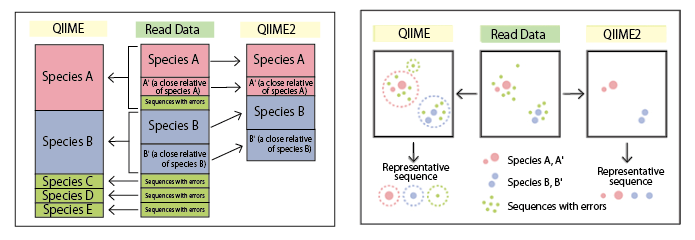
Q: What are the differences between QIIME and QIIME2?
QIIME generates representative sequences (Operational Taxonomy Unit: OTU), which may include sequences from closely related species.
QIIME2, by contrast, offers more precise error correction and species-level resolution.