- HOME
- Products & Services
- Application Selection Guide
- Illumina Amplicon Sequencing
Illumina Amplicon Sequencing
- Overview
- Applications
- Analysis Plan
- Sample Requirements
- Workflow
- Standard Data Analysis
- Optional Data Analysis
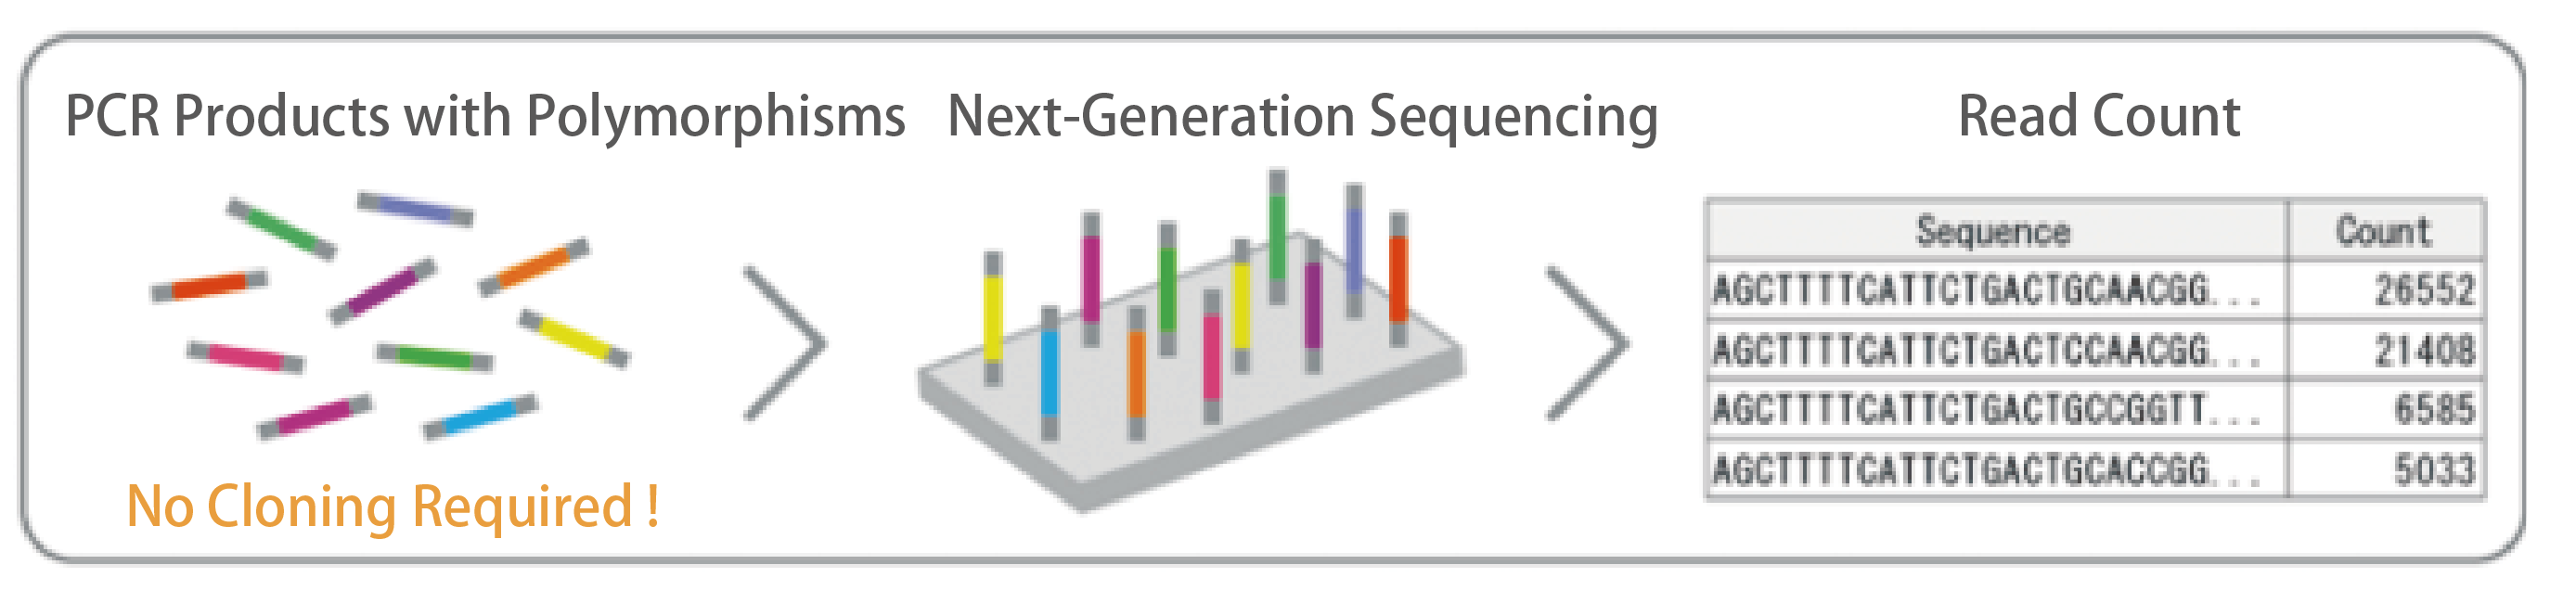
Overview
Applications
Analysis Plan
■ Choose your sequencing specifications based on PCR product size, the number of required reads, and the analysis purpose.
| Sequencer | NovaSeq | MiSeq |
| Read Method | Paired-End 150bp x 2 | Paired-End 300bp x 2 |
| Data Amount | 3.3 million read pairs (1Gb) / sample~ | 100,000 read pairs (60Mb) / sample~ |
| Recommended Insert Size(Compatible Insert Size) | 200bp – 250bp (Approx. 20bp – 800bp) |
250bp – 450bp (Approx. 20bp – 800bp) |
| PCR Product (Insert) Size | Sequencing is possible even if the PCR product size falls outside the recommended insert size range. However, data amount may not be guaranteed if the size significantly deviates from the recommended range. Please consult us if your size differs greatly.
For PCR products larger than the recommended size, the overlap between Read1 and Read2 becomes more difficult due to reduced quality values (QV) in the later part of the reads. In Amplicon-Seq, obtaining the full sequence of the amplicon relies on overlapping Read1 and Read2, so fewer effective reads will be generated for analysis. |
|
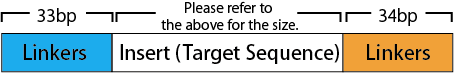
The total length of the linker sequences (FW + RV) is 67bp.
Sample Requirements
Please prepare samples according to the following conditions:
Workflow
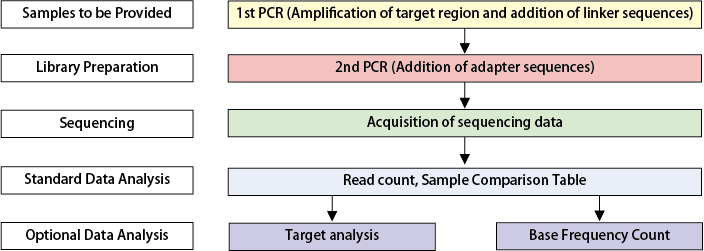
Standard Data Analysis
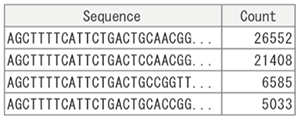
【Read Count】
Reads from Read1 and Read2 are merged for each sample, and identical sequences across the full length of the amplicon are counted.
[Read Count Results]
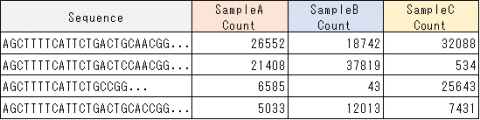
【Sample Comparison Table】
Read count results from each sample are integrated to generate a table for comparing read counts between samples.
[Comparison Table]
Optional Data Analysis
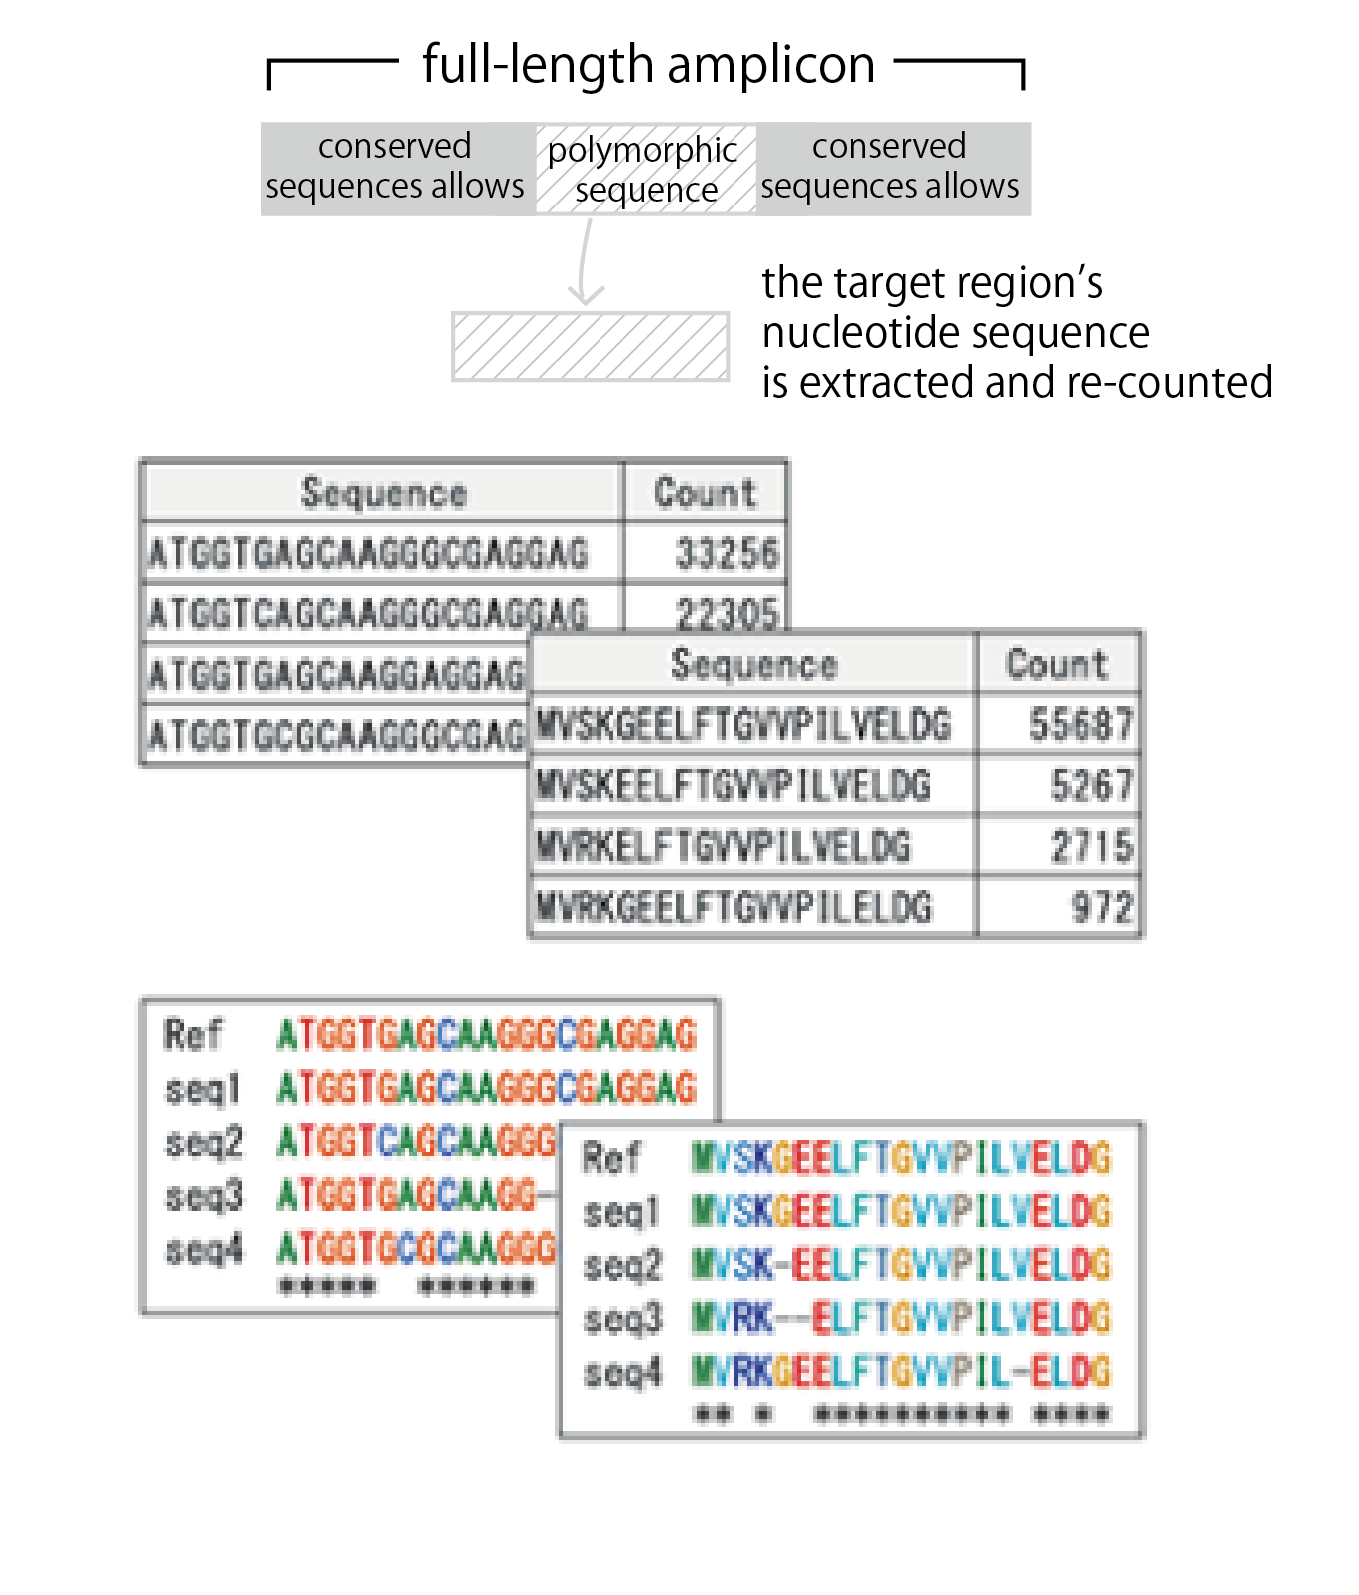
【Target analysis】
1. Extraction of Target Regions
From the full-length amplicon sequences, the target region’s nucleotide sequence is extracted and re-counted. Excluding conserved sequences allows for clearer visualization of polymorphic sequences.
2. Translation and Counting of Amino Acids
Nucleotide sequences are translated into amino acids, and the amino acid sequences are counted.
3. Alignment
Alignments are created for the top-sequence counts in both nucleotide and amino acid sequences. Reference sequences can also be included in the alignment.
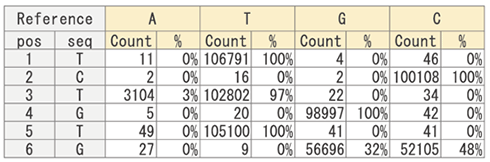
【Base Frequency Count】
Using read data, the frequency of each nucleotide (A, T, G, C) is calculated for each position in the reference sequence.
[Base Frequency Count Results]